Elucidation of a resistance mechanism against erdafitinib using differential gene expression analysis

  • Resistance to kinase inhibitors, such as the FGFR inhibitor erdafitinib, often manifests in patients after an initial good response.

  • Erdafitinib-resistant cell lines were generated in-house through exposure of cancer cells to increasing concentrations of erdafitinib. Subsequently, RNA sequencing was performed on the erdafinitib-sensitive parental cell line and two resistant clones.

  • A clustering analysis was performed on three technical replicates of RNA sequencing data for the parental cell line and the two resistant clones. This analysis considers the complete gene expression profile of all samples. The results show that the expression profiles of the two resistant clones differ from that of the parental cell line (Figure 1a).

  • Subsequently, it was determined which genes are most differentially expressed in one of the resistant clones compared to the parental cell line. The volcano plot shows that the potential resistance mechanism is probably not based on a single gene but likely stems from differential expression of multiple genes (Figure 1b).

  • A Gene Set Enrichment Analysis (GSEA) was performed on the differentially expressed genes to identify a set of genes representing the mechanism that is causing resistance against erdafitinib. The results of the GSEA show that many of the genes which are overexpressed in the resistant clone are involved in signaling of the transcription factor c-Myc (Figure 2).

  • Accordingly, immunoblot analysis revealed alterations in c-Myc expression during a time-course of erdafitinib treatment (Figure 3). Increased sensitivity to c-Myc inhibition was confirmed via indirect targeting with BET inhibitors JQ1 and I‑BET-762 (Figure 4).

  • These results suggest that expression of c-Myc is involved in resistance against erdafitinib and can be explored as a target to overcome resistance.

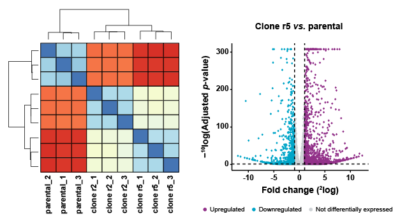
Figure 1 | Comparison of RNA expression profiles of the parental cell line and erdafitinib-resistant clones. (left) Clustering analysis of the technical replicates (n = 3) for the parental cell line and two erdafitinib-resistant clones. (right) Differential gene expression analysis between erdafitinib-resistant clone 5 and the parental cell line.
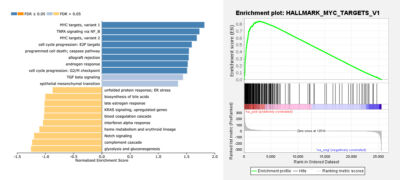
Figure 2 | Gene set enrichment analysis for overexpressed genes. (left) A barplot showing the gen set enrichment results. (right) The enrichment lot for Myc target gene set v1.
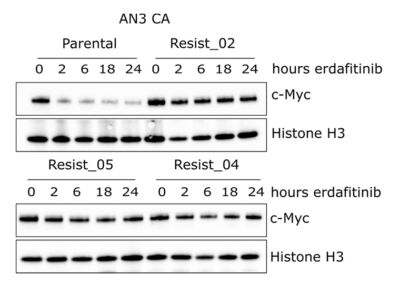
Figure 3 | c-Myc expression in parental and resistant cells. c-Myc protein expression was analyzed for the parental cell line and erdafitinib-resistant clones by immunoblotting.
xenograft model
Figure 4 | In vitro testing of BET inhibitors JQ1 and I-BET-762. Dose response curves of (left) JQ1 and (right) I-BET-762 on the parental and erdafitinib-resistant cells.