Identify predictive drug-response protein biomarkers using ProteomicsProfiler™
ProteomicsProfiler™ is designed to identify predictive drug-response biomarkers based on protein expression using bioinformatics analyses. Although gene expression is often used as a surrogate marker for protein levels, gene and protein expression levels can vary strongly in cells, for instance through rapid protein degradation. Therefore, ProteomicsProfiler™ can provide insight into the mechanism underlying cell line response to an anti-cancer drug. In this way, ProteomicsProfiler™ can aid in validating or identifying the protein target, biomarker discovery, or patient stratification for an anti-cancer drug.
Gain novel insights into biological markers to support development of
anti-cancer drugs
An anti-cancer drug may act through an individual protein or a network of proteins cooperating in a biological functionality. The ProteomicsProfiler™ bioinformatics analysis provides:
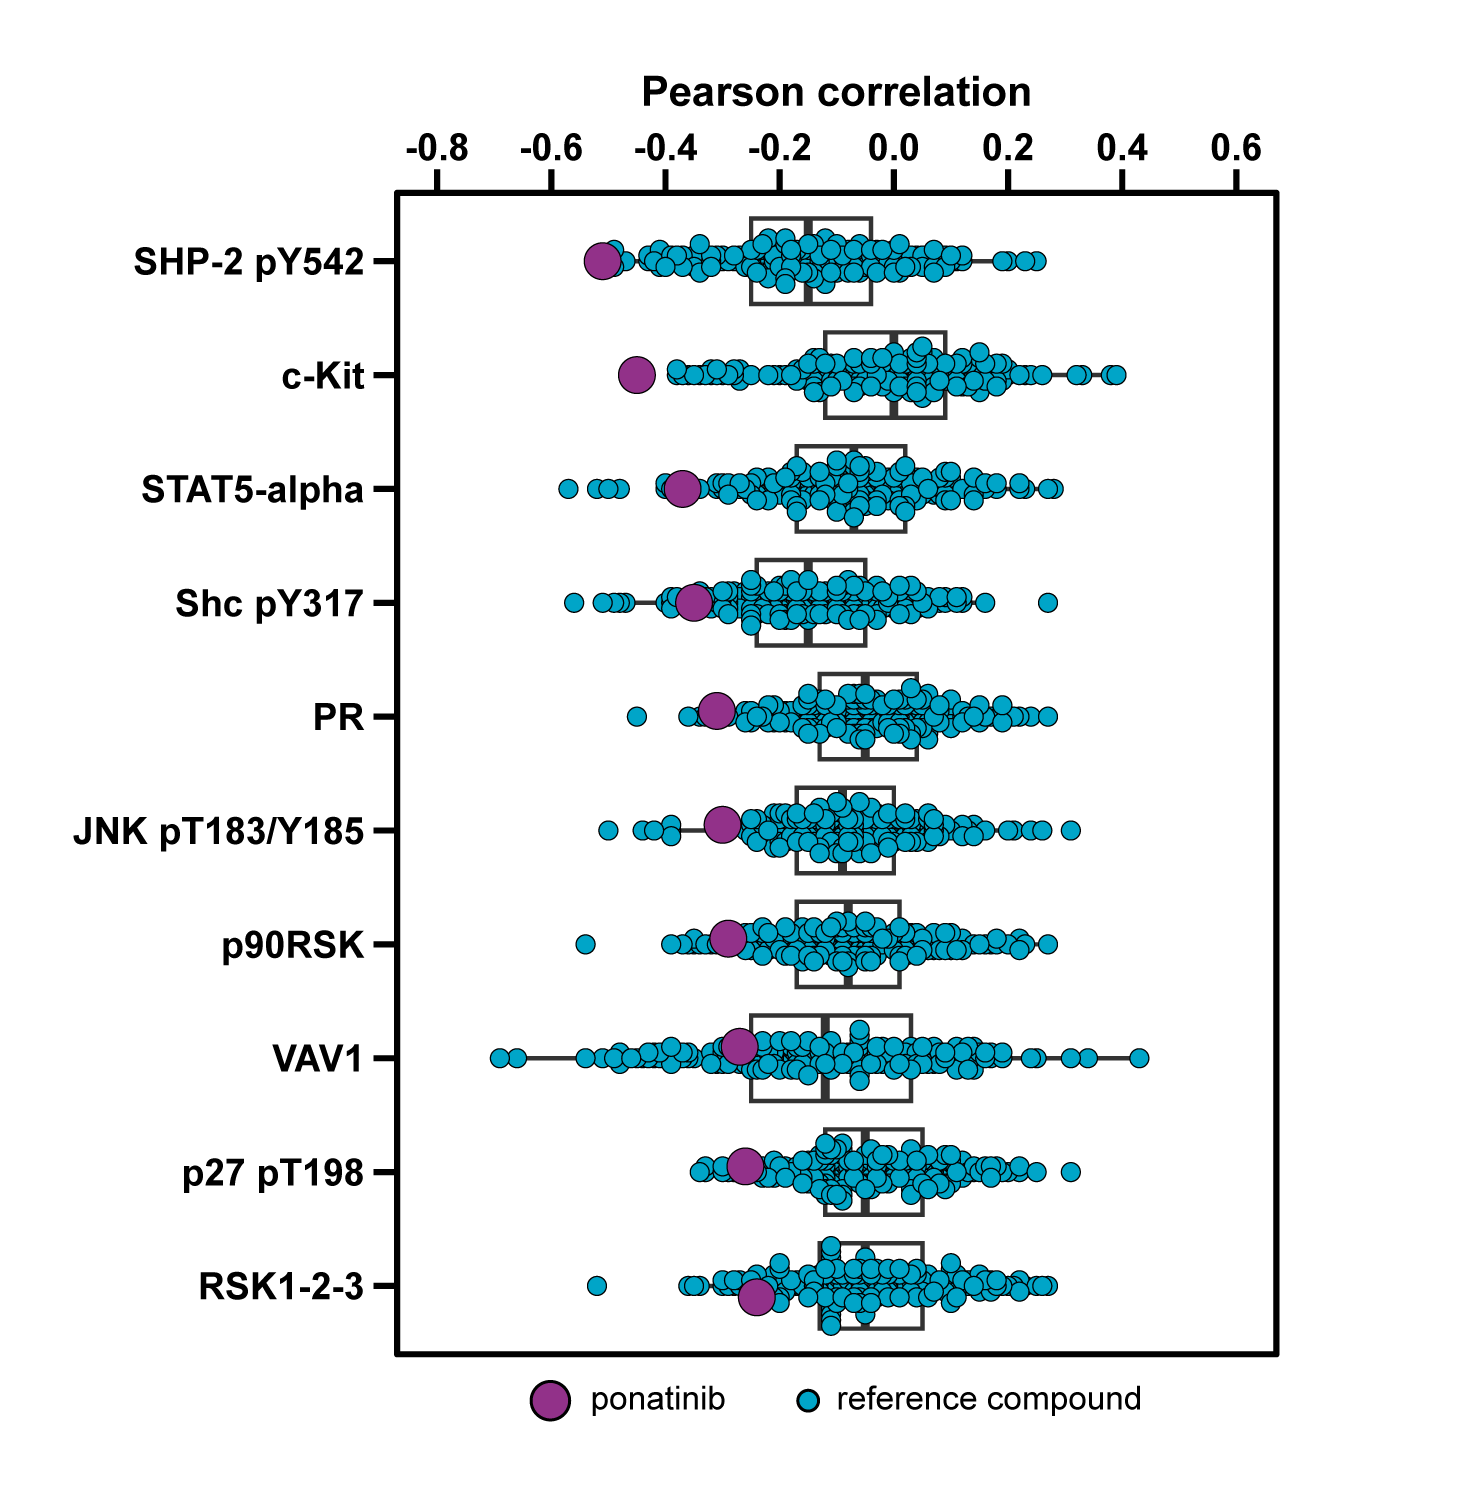
ProteomicsProfiler™ analysis for the multi-tyrosine kinase inhibitor ponatinib shows a relation between drug sensitivity and expression of phosphorylated SHP2.
Focus on specific biological contexts
Protein expression correlation analysis is used to determine the relation between drug response, based on cell viability assays, and differential expression of individual proteins. This extensive analysis covers thousands of proteins retrieved from two independent datasets. The unbiased approach of ProteomicsProfiler™ can validate hypotheses or uncover unexpected relations for your compound. In order to add relevance to the protein correlations, subsets of proteins known to be involved in a specific context are selected, such as phosphorylated proteins or proteins which play a role in drug resistance. The landscape of protein correlations is further explored by analyzing proteins which cooperate in the same signaling pathway or biological processes.
Determine the uniqueness of your compound’s protein correlation signature
The top correlating proteins for your compound are compared to a library of 272 pre-profiled therapeutics, representing a broad range of mechanisms (e.g., MAPK pathway inhibitors, DNA damage response inhibitors, and classical chemotherapeutics). The comprehensive visualization of ProteomicsProfiler™ directly shows the uniqueness of your compound’s correlation profile.
Techniques for detection of protein expression levels
Several techniques can be used to determine protein expression levels in cancer cell lines, including reverse phase protein array (RPPA) and mass spectrometry (MS). These techniques both have their advantages and drawbacks (Table 1). ProteomicsProfiler™ bioinformatics analysis includes protein expression datasets based on both techniques.
Table 1: Advantages and drawbacks of RPPA and MS for determining protein expression levels.
|
RPPA |
MS |
|
|---|---|---|
| Advantages | High-throughput proteomics platform | High-throughput and cost-effective proteomics platform |
| Allows detection of post-translational modifications, such as phosphorylation | High sensitivity and specificity | |
| Disadvantages | Relies on high-quality mono-specific antibodies, which can be plagued by unexpected off-target activity | Limited ability to detect low protein levels and post-translational modifications, such as phosphorylation |
| Limited number of available antibodies | The number of cell lines for which expression data are available may vary between proteins |