Oncolines® Proliferation Assays and Biomarker Analysis
Helping to Bring Improved and Novel Therapies to the Right Patient Population Faster
The activity of your compound is determined by proliferation assays on a cancer cell line panel of 102 tumor cell lines. The cell proliferation data are subjected to bioinformatic analyses to determine tissue selectivity of your compound. Cell line sensitivity data are related to cell line genetic data to identify drug response biomarkers. These biomarkers can be used in the experimental design of subsequent in vivo or ex vivo validation experiments. Once validated, these biomarkers can form the basis for selecting the patient population most likely to respond to your compound in proof-of-concept clinical trials.
Oncolines Characteristics
Quality Features
Compound Activity Parameters from Dose Response Curves
In an Oncolines® experiment, dose response curves are measured on 102 cell lines in parallel (Uitdehaag et al., 2019), or on a selection of cell lines. From each curve we derive IC50, LD50 and GI50 parameters, as well as maximum effects and Hill parameters (curve steepness). The latter has been described by Hafner et al. (2016). We also check the cell doubling times for each cancer cell line every time, for every assay. You will receive a Word report with 102 dose response curves and a summary table with growth parameters for each cell line via a secured link. Raw data are provided in Excel via a secured link, so you can analyse the data as you like.
Biomarker Discovery
The growth parameters can be used to correlate drug response to cellular genetic background. The differences between IC50, LD50 and GI50 are subtle and can be important. In the figure they are explained for your convenience. Click on the charts to enlarge.
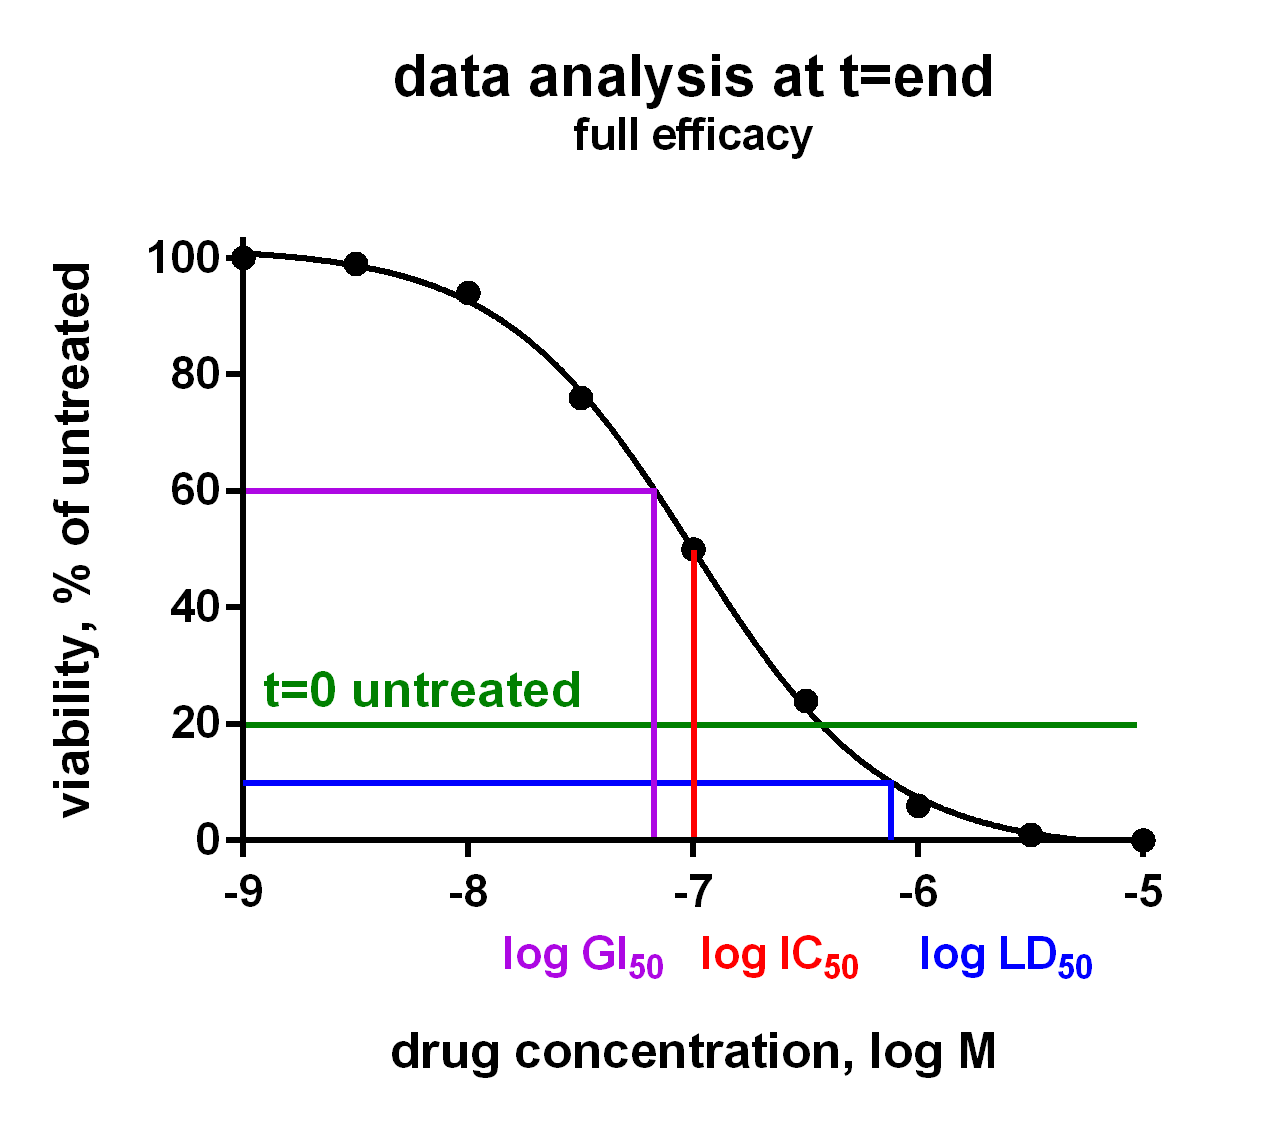
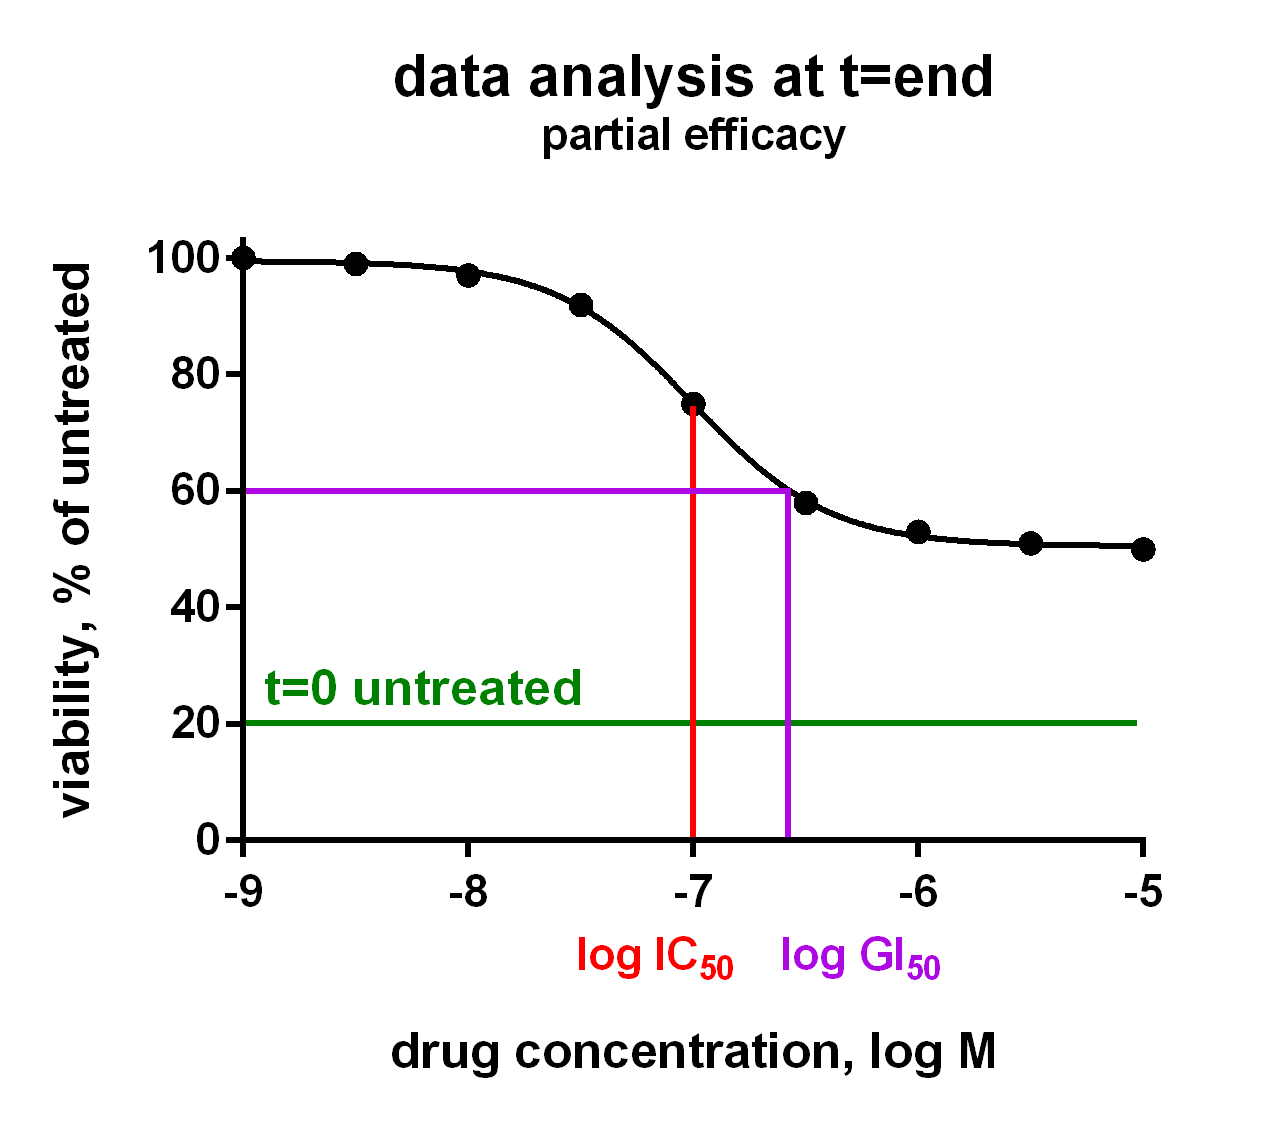
Graphic display of IC50, GI50 and LD50 of a compound showing full efficacy (100% inhibition), in the left chart, and partial efficacy (50% inhibition), in the right chart
Identification of Novel Drug Sensitivity Markers
Because all Oncolines® cancer cell lines have been genetically characterized, the activity parameters of small molecule compounds and antibodies are statistically coupled to the presence of changes in cancer genes, such as mutations, translocations, amplifications or deletions (Iorio et al., 2016).
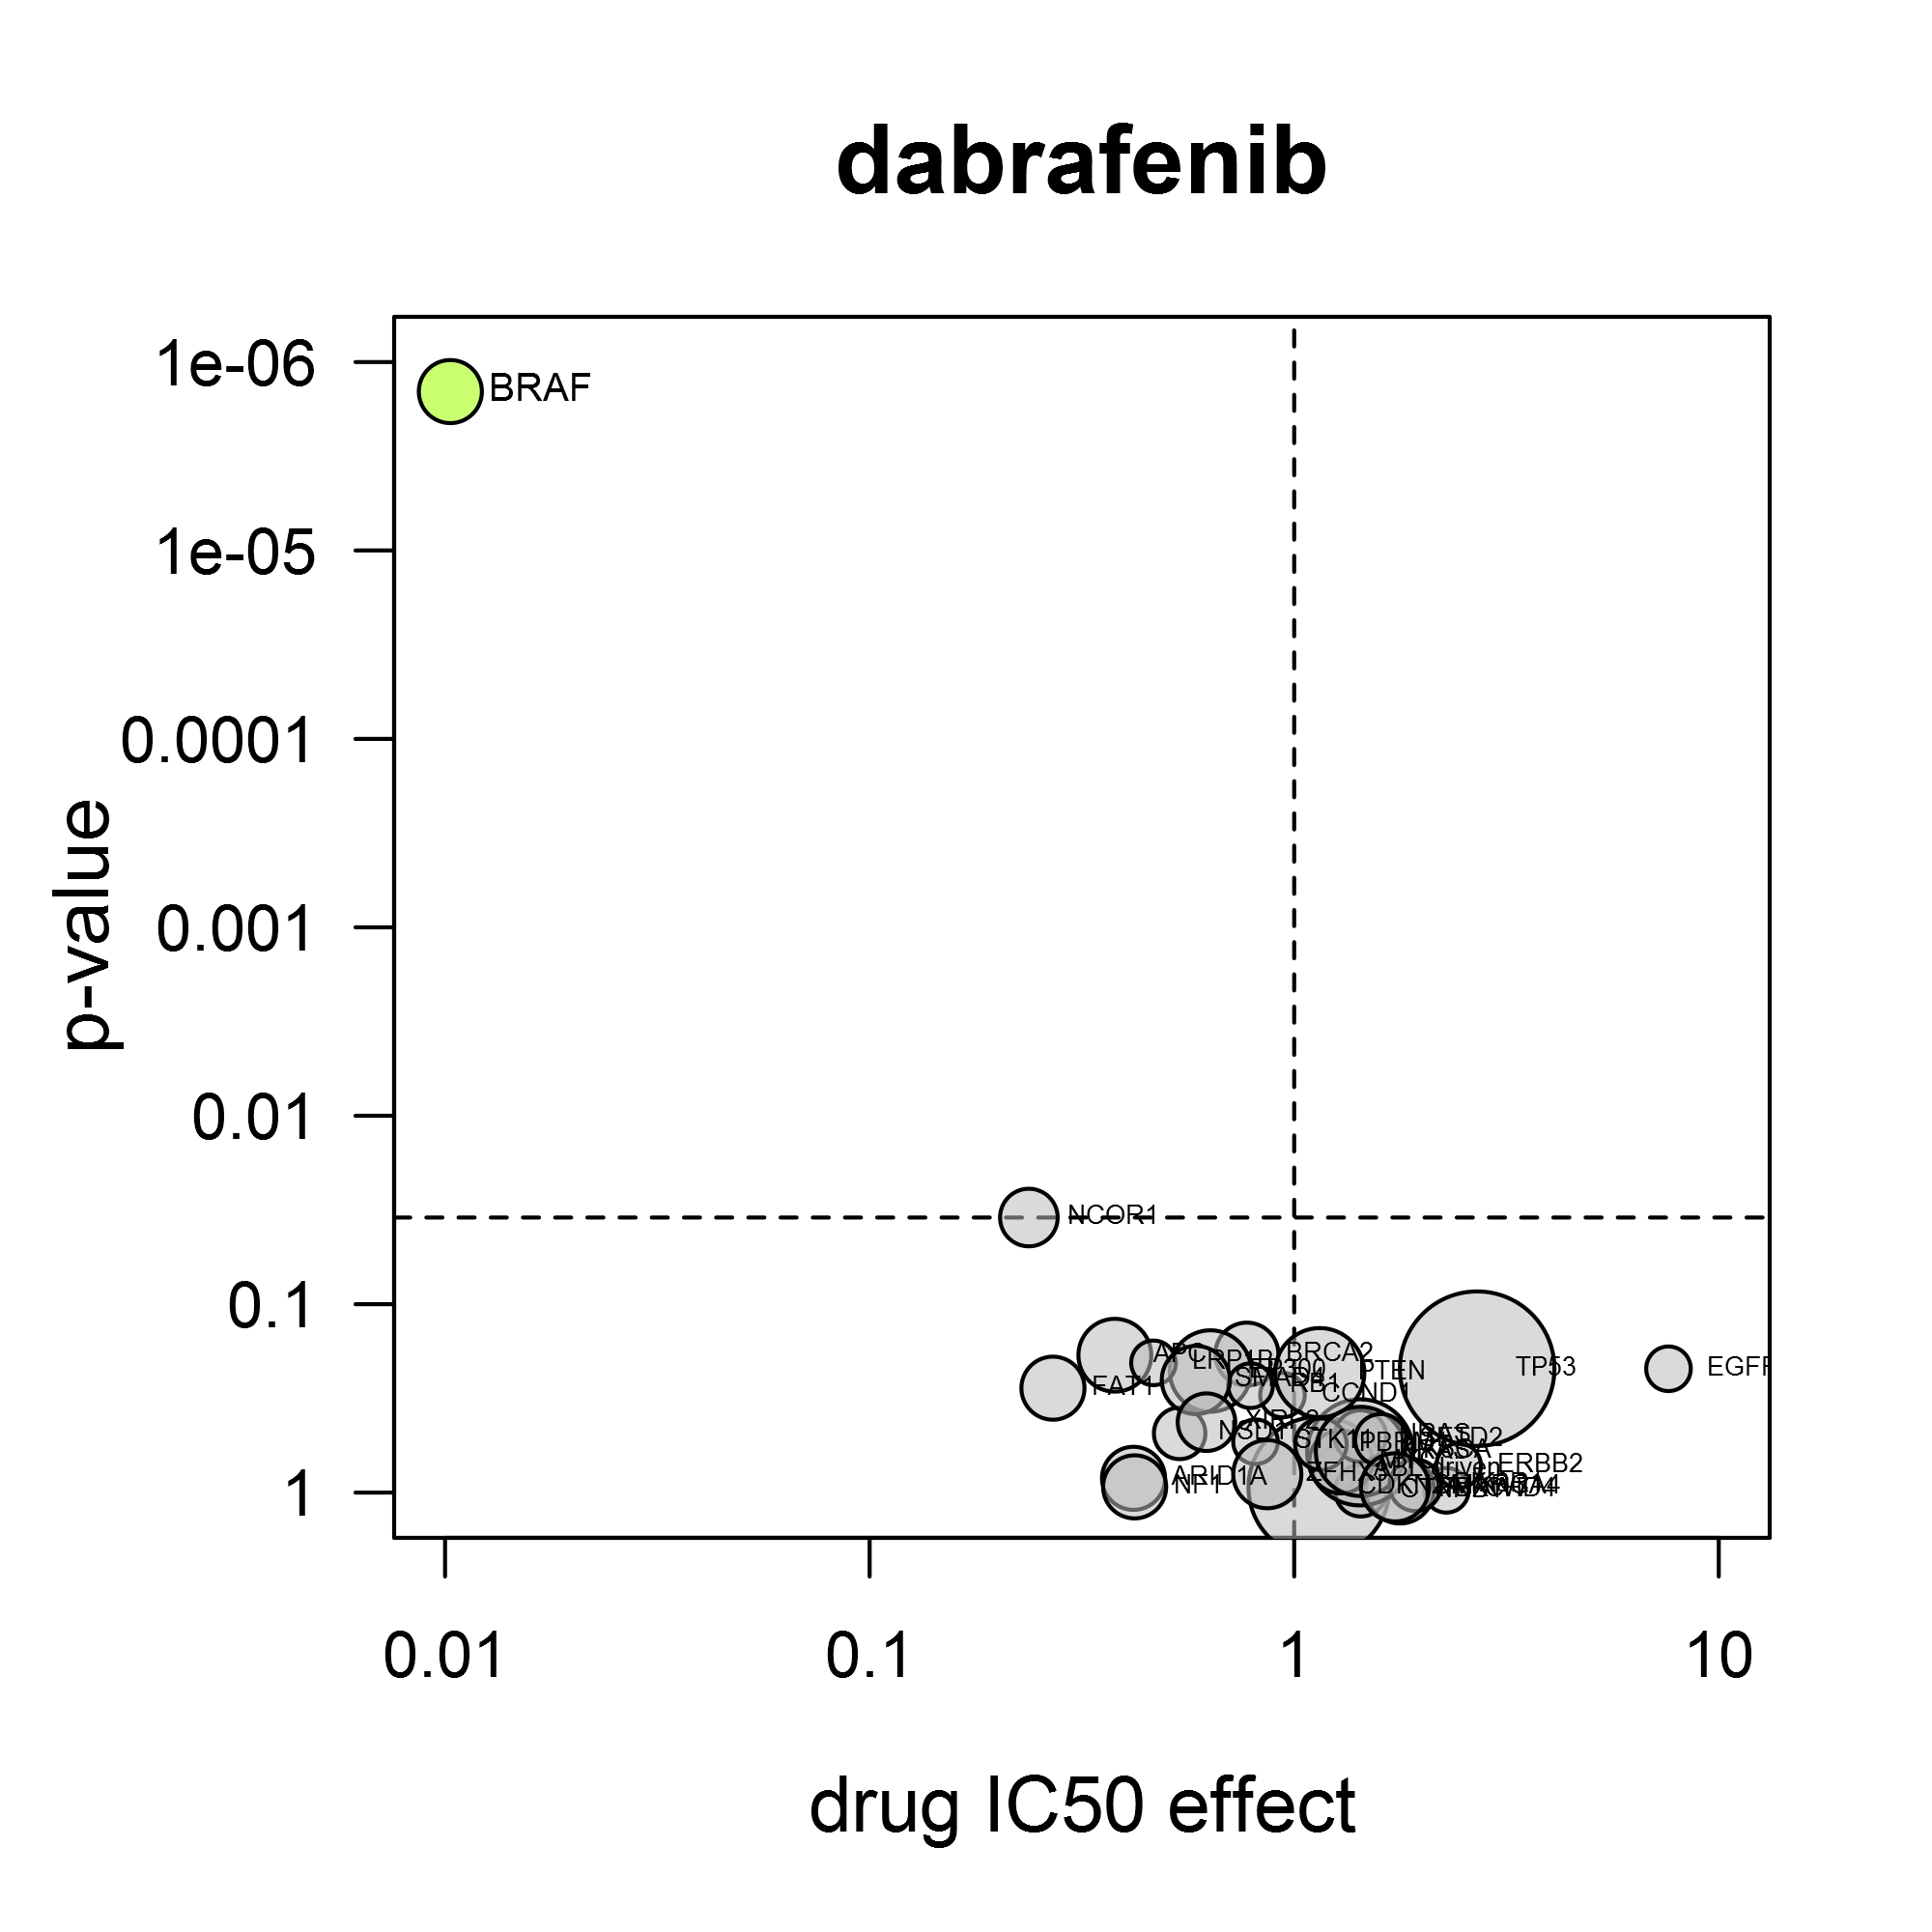
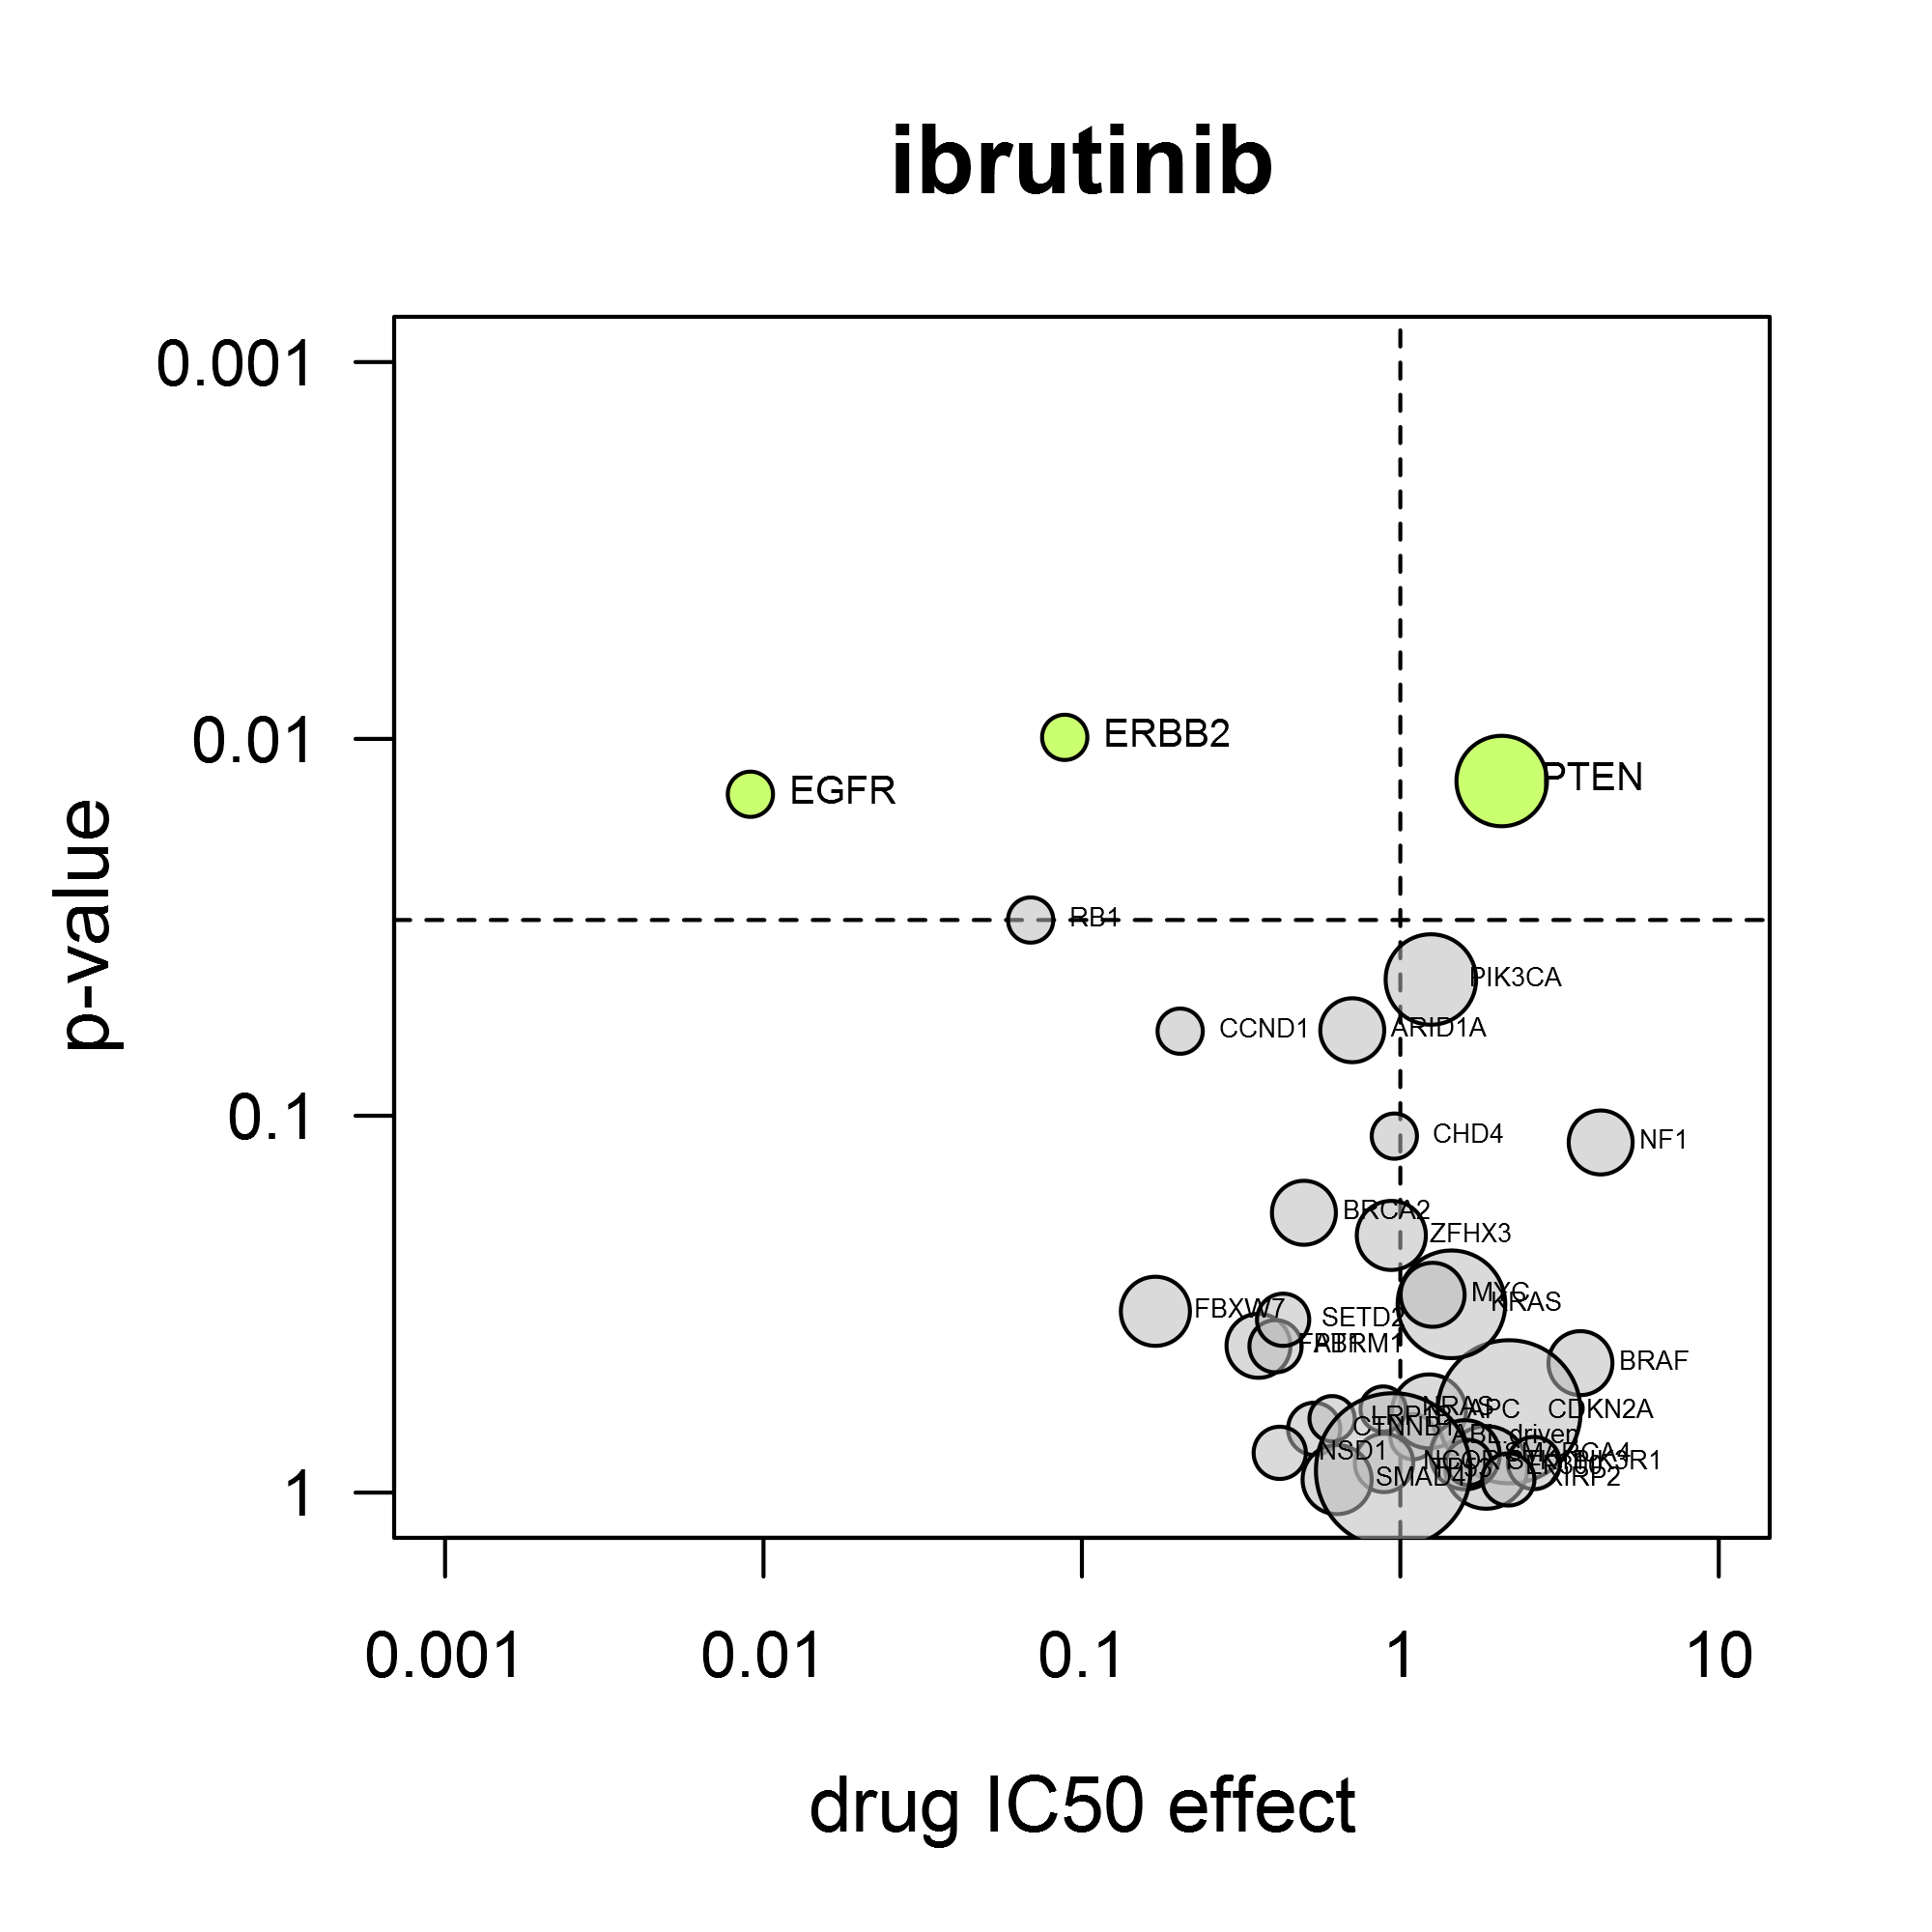
Oncolines volcano plots for dabrafenib (left) and ibrutinib (right) showing the relationship between cell line sensitivity and mutant status of cancer genes.
A volcano plot shows the average IC50 shift between mutant and non-mutant cell lines and the statistical significance of that difference. The power of the volcano analysis is that it allows simultaneous testing of changes in many validated cancer genes.
For the response to dabrafenib (Tafinlar®), it is clear that BRAF mutation confers sensitivity for this compound (left). As another example, the BTK-inhibitor ibrutinib (Imbruvica®) also inhibits EGFR and HER2. Consistent with this, it preferentially inhibits cell lines containing activating mutations in EGFR or ERBB2 (gene for HER2) (right).
Volcano analysis can reveal unexpected drug sensitivity markers. We have found several by applying our own kinase reference inhibitor set, as described by Uitdehaag et al. (2019). The case study ‘CDK4/6 inhibitors’ provides an illustration of the gene mutation analysis.
Cancer Gene Mutations
Sequencing of the human genome has led to an increased understanding of the mechanisms that underlie the onset and progression of cancer. This knowledge is applied in the development of novel cancer therapies. Oncolines® contains at least three representative cell lines for 98 oncogenic mutations (Iorio et al., 2016, Lawrence et al., 2014). Oncolines has developed its own proprietary workflow to filter cancer-causing genes from other mutations, which takes into account evidence from mutational hotspots and occurrence in patients.
Tissue Sensitivity Analysis
The approval label of many drugs specifically states use in cancer of a certain tissue type, for instance, breast or lung. In any approach to precision medicine, cancer lineage should therefore be taken into account. Oncolines® includes such tissue type analysis, indicating whether anti cancer drugs or drug candidates show preferential activity in a certain cancer tissue type. Annotation of disease indication conforms to the Cellosaurus database (Bairoch, 2018). The associated tissue types are hierarchically organized according to the Oncotree classification (Oncotree).
As an example, Oncolines® tissue-type analysis has revealed that the CDK4/6 inhibitor ribociclib (Kisqali®) potently inhibits proliferation of cell lines of neuroblastoma origin. This finding supports ongoing clinical studies (Geoerger et al., 2017).
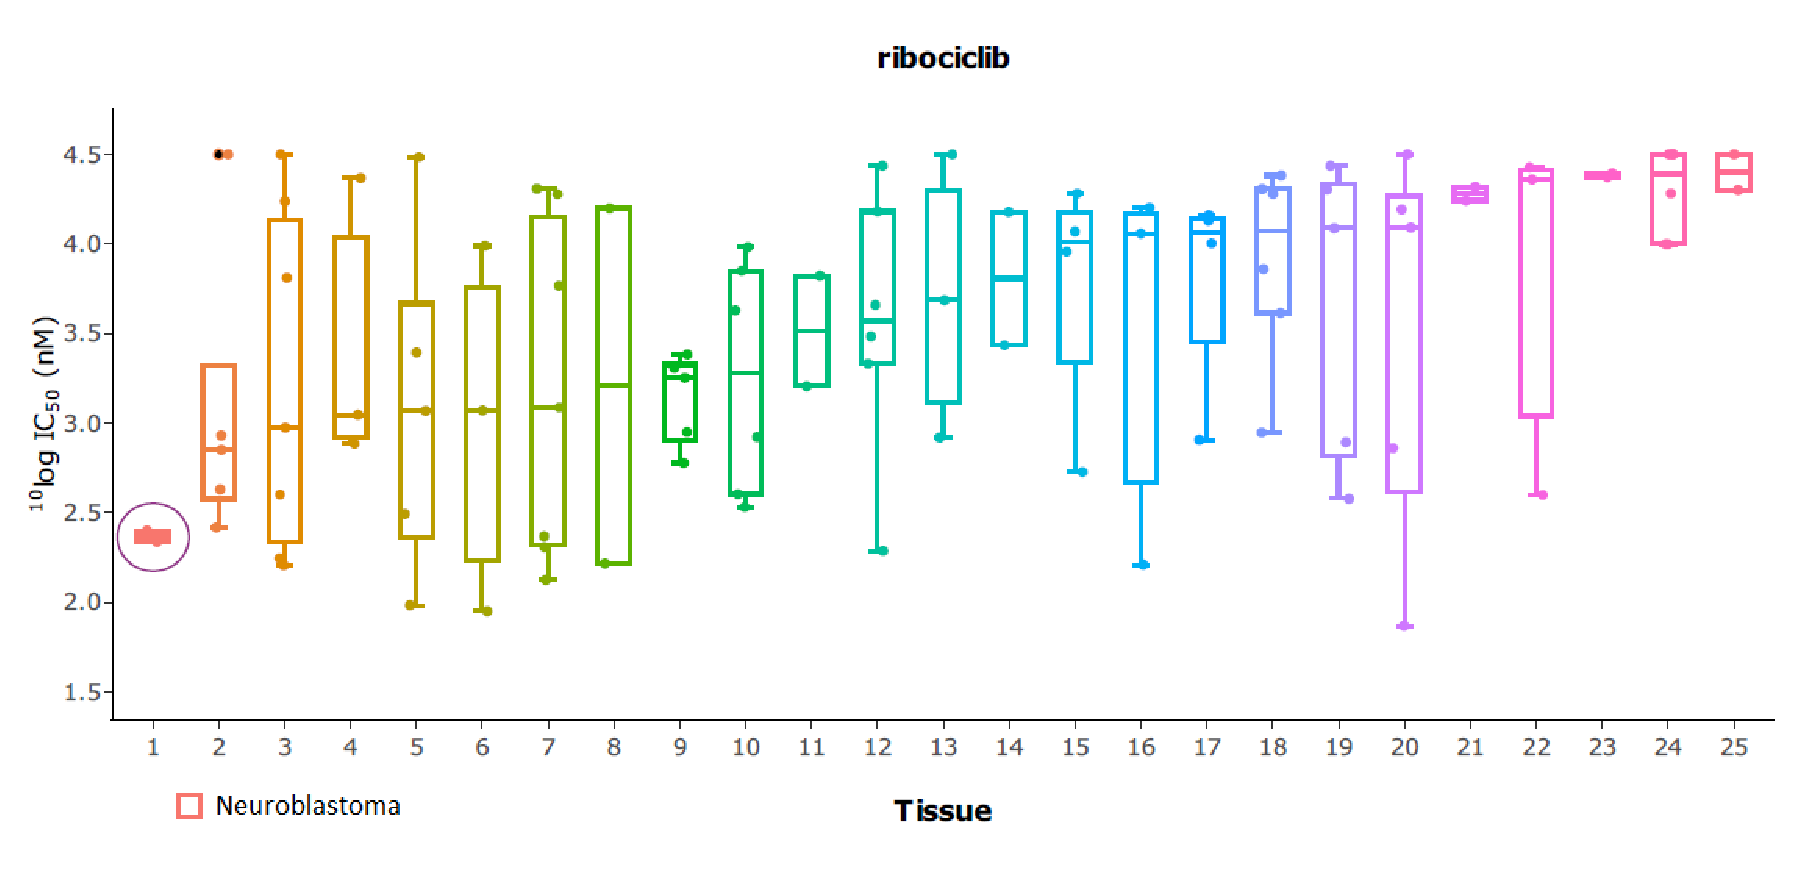
The tissue type boxplot for ribociclib shows sensitivity of neuroblasoma cell lines. Ribociclib is under investigation for neuroblastoma in clinical trials.
Comparative Analysis for Target Finding and Confirmation
Comparative analysis is used to find or confirm the target of your compound. Your compound may be the result of a unique scaffold or may have emerged from phenotypical screens, in which case the biochemical target can be speculative. The intention to repurpose drugs may also trigger the need for target finding or confirmation. Clustering analysis of a broad range of anti-cancer therapeutics will determine if your compound falls within a target group.
Mapping your Compound in the Competitive Field
The clustering analysis compares your compound’s IC50 fingerprint with the cellular activity of 272 anti-cancer therapeutics. The latter include standards of care, clinical stage candidates and experimental therapeutics. The anti cancer drug list covers the wide variety of targets that is clinically applied or under investigation. Targets include tubulin, proteasome, topoisomerase, ubiquitin pathway, bromodomain, kinases, Wnt pathway, RNA synthesis, HDAC, EZH2, anti-apoptotic mechanisms and others.
Best-In-Class and First-In-Class Inhibitors
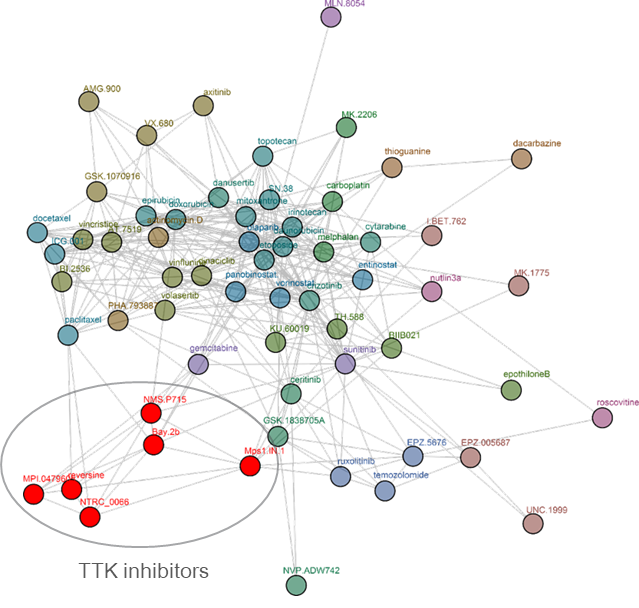
Clustering tree for reversine. Reversine was originally identified in a phenotypic screen for molecules that can promote dedifferentiation of myoblasts into multipotent progenitor-like cells (Chen et al. 2007), which was attributed to its ability to inhibit Aurora B (d’Alise et al., 2008). Later, it was shown that reversine can inhibit TTK (Santaguida et al., 2008). The comparative analysis shows that reversine targets TTK (Libouban et al., 2017). Other TTK inhibitors are pictured in red.
The target for best in class inhibitors is confirmed when your compound shares a cluster with the relevant targeted therapeutics. For instance, it may fall within the cluster of selective PI3K inhibitors instead of pan-PI3K inhibitors. Its best in class properties emerge from improved potency, increased tissue selectivity, or selectivity for a genomic biomarker.
When you are working on a novel mechanism, your compound will be unique and located separately from all other therapeutics in the database. The exact targeting can be found by knock-down experiments, and gene or protein expression analysis.


Features of the Comparative Analysis
Oncolines® Test Range and Data Quality
Often compounds need to be prioritized on the basis of small differences and also drug sensitivity is often based on subtle shifts, so reproducibility is a crucial factor in cellular compound profiling. Reproducibility of Oncolines® profiling has been described by Uitdehaag et al. (2016). Oncolines® dose response curves are calculated on basis of 9 duplicate points, spanning four log decades in concentrations (31.6 µM – 3.16 nM). The high starting concentration and large range means that the IC50s of most compounds will fall inside the measured range and there is no need to extrapolate as some other panels do (GDSC; Garnett et al., 2012). Furthermore, if your compound is too potent to give an interpretable curve within the concentration range tested, we’ll dilute it and retest it for free.
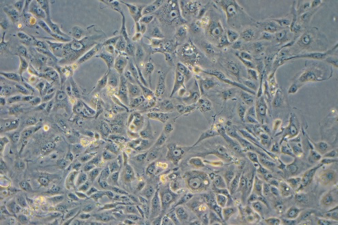
Cell line 769-P
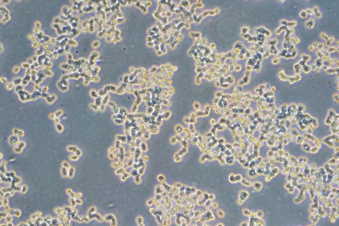
Cell line SW48
We also realize that cell lines can undergo changes when cultured for extended cell line generations. Therefore, we maintain our cell banks with an absolute minimum of cell passages. All assays are performed within 10 passages from the original ATCC vial. The cell lines are cultured in the ATCC recommended medium for each cell line. For each cancer cell line we check the cell doubling times for every assay.
References
Uitdehaag et al. (2016) Cell Panel Profiling Reveals Conserved Therapeutic Clusters and Differentiates the Mechanism of Action of Different PI3K/mTOR, Aurora Kinase and EZH2 Inhibitors. Molecular Cancer Therapeutics, 15 (12):3097-3109.
Uitdehaag et al. (2019) Combined cellular and biochemical profiling to identify predictive drug response biomarkers for kinase inhibitors approved for clinical use between 2013 and 2017. Molecular Cancer Therapeutics, 18 (2):470-481.
Hafner et al. (2016) Growth rate inhibition metrics correct for confounders in measuring sensitivity to cancer drugs. Nature Methods, 13:521-527.
Iorio et al. (2016) A landscape of pharmacogenomic interactions in cancer. Cell, 166 (3):740-754.
Lawrence et al. (2014) Discovery and saturation analysis of cancer genes across 21 tumour types. Nature, 505:495-501.
Bairoch (2018) The Cellosaurus, a cell line knowledge resource. Journal of Biomolecular Techniques, 29 (2):25-38.
Memorial Sloan Kettering Cancer Center
Geoerger et al. (2017) A Phase I Study of the CDK4/6 Inhibitor Ribociclib (LEE011) in Pediatric Patients with Malignant Rhabdoid Tumors, Neuroblastoma, and Other Solid Tumors. Clinical Cancer Research, 23 (10):2433-2441.
Chen et al. (2007) Reversine increases the plasticity of lineage-committed mammalian cells. PNAS, 104 (25):10482-10487.
d’Alise et al. (2008) Reversine, a novel Aurora kinases inhibitor, inhibits colony formation of human acute myeloid leukemia cells. Molecular Cancer Therapeutics, 7 (5):1140-1149.
Santaguida et al. (2008) Dissecting the role of MPS1 in chromosome biorientation and the spindle checkpoint through the small molecule inhibitor reversine. Journal of Cell Biology, 190 (1):73-87.
Libouban et al. (2017) Stable aneuploid tumors cells are more sensitive to TTK inhibition than chromosomally unstable cell lines. Oncotarget, 8 (24):38309-38325.
Garnett et al. (2012) Systematic identification of genomic markers of drug sensitivity in cancer cells. Nature, 483:570–575.