Gene Mutation Analysis for Patient Stratification Strategies Using Response Biomarkers
Helping to Bring Improved and Novel Therapies to the Right Patient Population Faster
The mechanism of action of your compound can be investigated with response parameters of cancer cell line profiling without the need for additional experiments. For instance, we perform analysis of variance (ANOVA) on IC50 values and gene mutation data to identify genomic drug response biomarkers for cancer. Case studies have confirmed patient stratification markers that have been used in the clinic (Uitdehaag et al., 2019).
Selection of Patients Likely to Respond
Precision medicine is about the match between drug targeting and patients’ individual responses. Early proof of concept studies on response pathways help to progress your drug candidates towards the clinic and select patients whose genetic makeup corresponds to the drug’s target.
Identification of Oncogenic Mutation Markers
Genetic variations occur in many capacities and only a restricted number of DNA mutations has been implicated in cancer. With the aim to identify biomarkers that have clinical relevance, the pharmacogenomics analysis at Oncolines concerns mutations that have been observed in cancer patients. Clinically actionable mutations are analysed by zooming in on independently validated hotspot mutations and copy number variations.
Your Compound May Target a Subpopulation of Patients
We can help you to identify a patient stratification marker for your compound. Cancer cell line profiling data, generally IC50 data, is used as a source of input. In case your mechanism is better represented by another parameter (e.g. Area Under the Curve), we adapt the analysis accordingly.
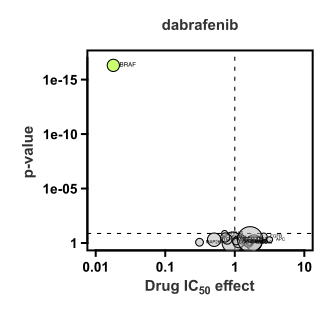
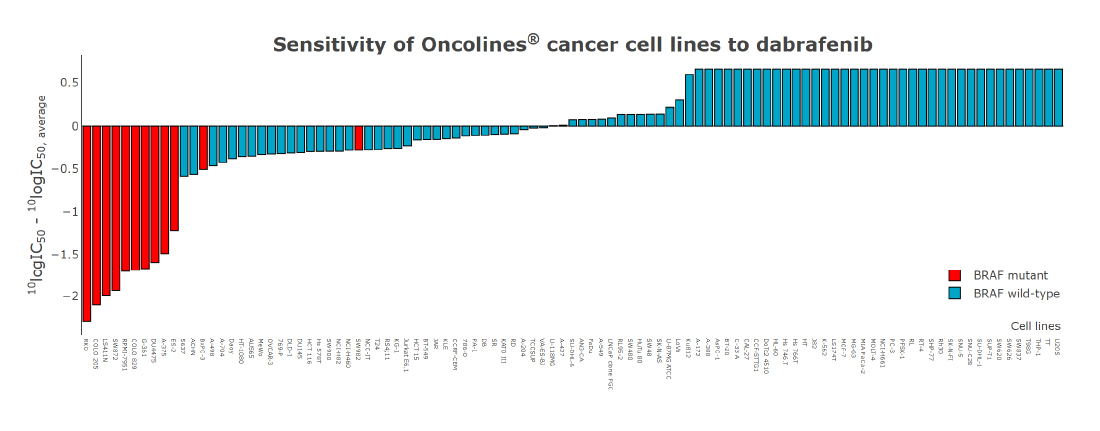
The volcano plot shows the relationship between cell line sensitivity and mutant status of cancer genes. Cell lines with a BRAF mutation are on average ~100X more sensitive to dabrafenib than wild type cell lines (x-axis; the value 1 represents the average IC50 on a log scale). The p-value (y-axis) represents the statistical significance.

References
Zaman et al. (2017) TTK inhibitors as a targeted therapy for CTNNB1 (β-catenin) mutant cancers. Molecular Cancer Therapeutics, 16 (11):2609-2617.
Uitdehaag et al. (2019) Combined cellular and biochemical profiling to identify predictive drug response biomarkers for kinase inhibitors approved for clinical use between 2013 and 2017. Molecular Cancer Therapeutics, 18 (2):470-481.
Kooijman et al. (2022) Comparative kinase and cancer cell panel profiling of kinase inhibitors approved for clinical use from 2018 to 2020. Frontiers in Oncology, 12:953013.