Protein expression analysis identifies predictive drug-response markers for the MEK inhibitor trametinib

  • Trametinib is a highly selective MEK inhibitor that is currently approved by the FDA for treatment of cancers which harbor a BRAF-V600 mutation.

  • In cell viability assays on a panel of 102 cancer cell lines (the Oncolines® cell line panel), BRAF-mutant cell lines were responsive to trametinib, while KRAS and NRAS-mutants showed variable responses, reflecting clinical observations (Figure 1).[1]

  • To identify mutation-independent drug-response biomarkers, we correlated the trametinib IC50 profile in the 102 cancer cell lines to the expression levels of thousands of proteins in the same cell lines using bioinformatics analysis.
  • The expression of phosphorylated MEK is strongly correlated with increased sensitivity to trametinib (Figure 2), suggesting that increased activation of the MAPK pathway sensitizes cell lines to trametinib.

Reference

[1] Blumenschein et al. (2015) Ann Oncol. 26, 894-901

Trametinib
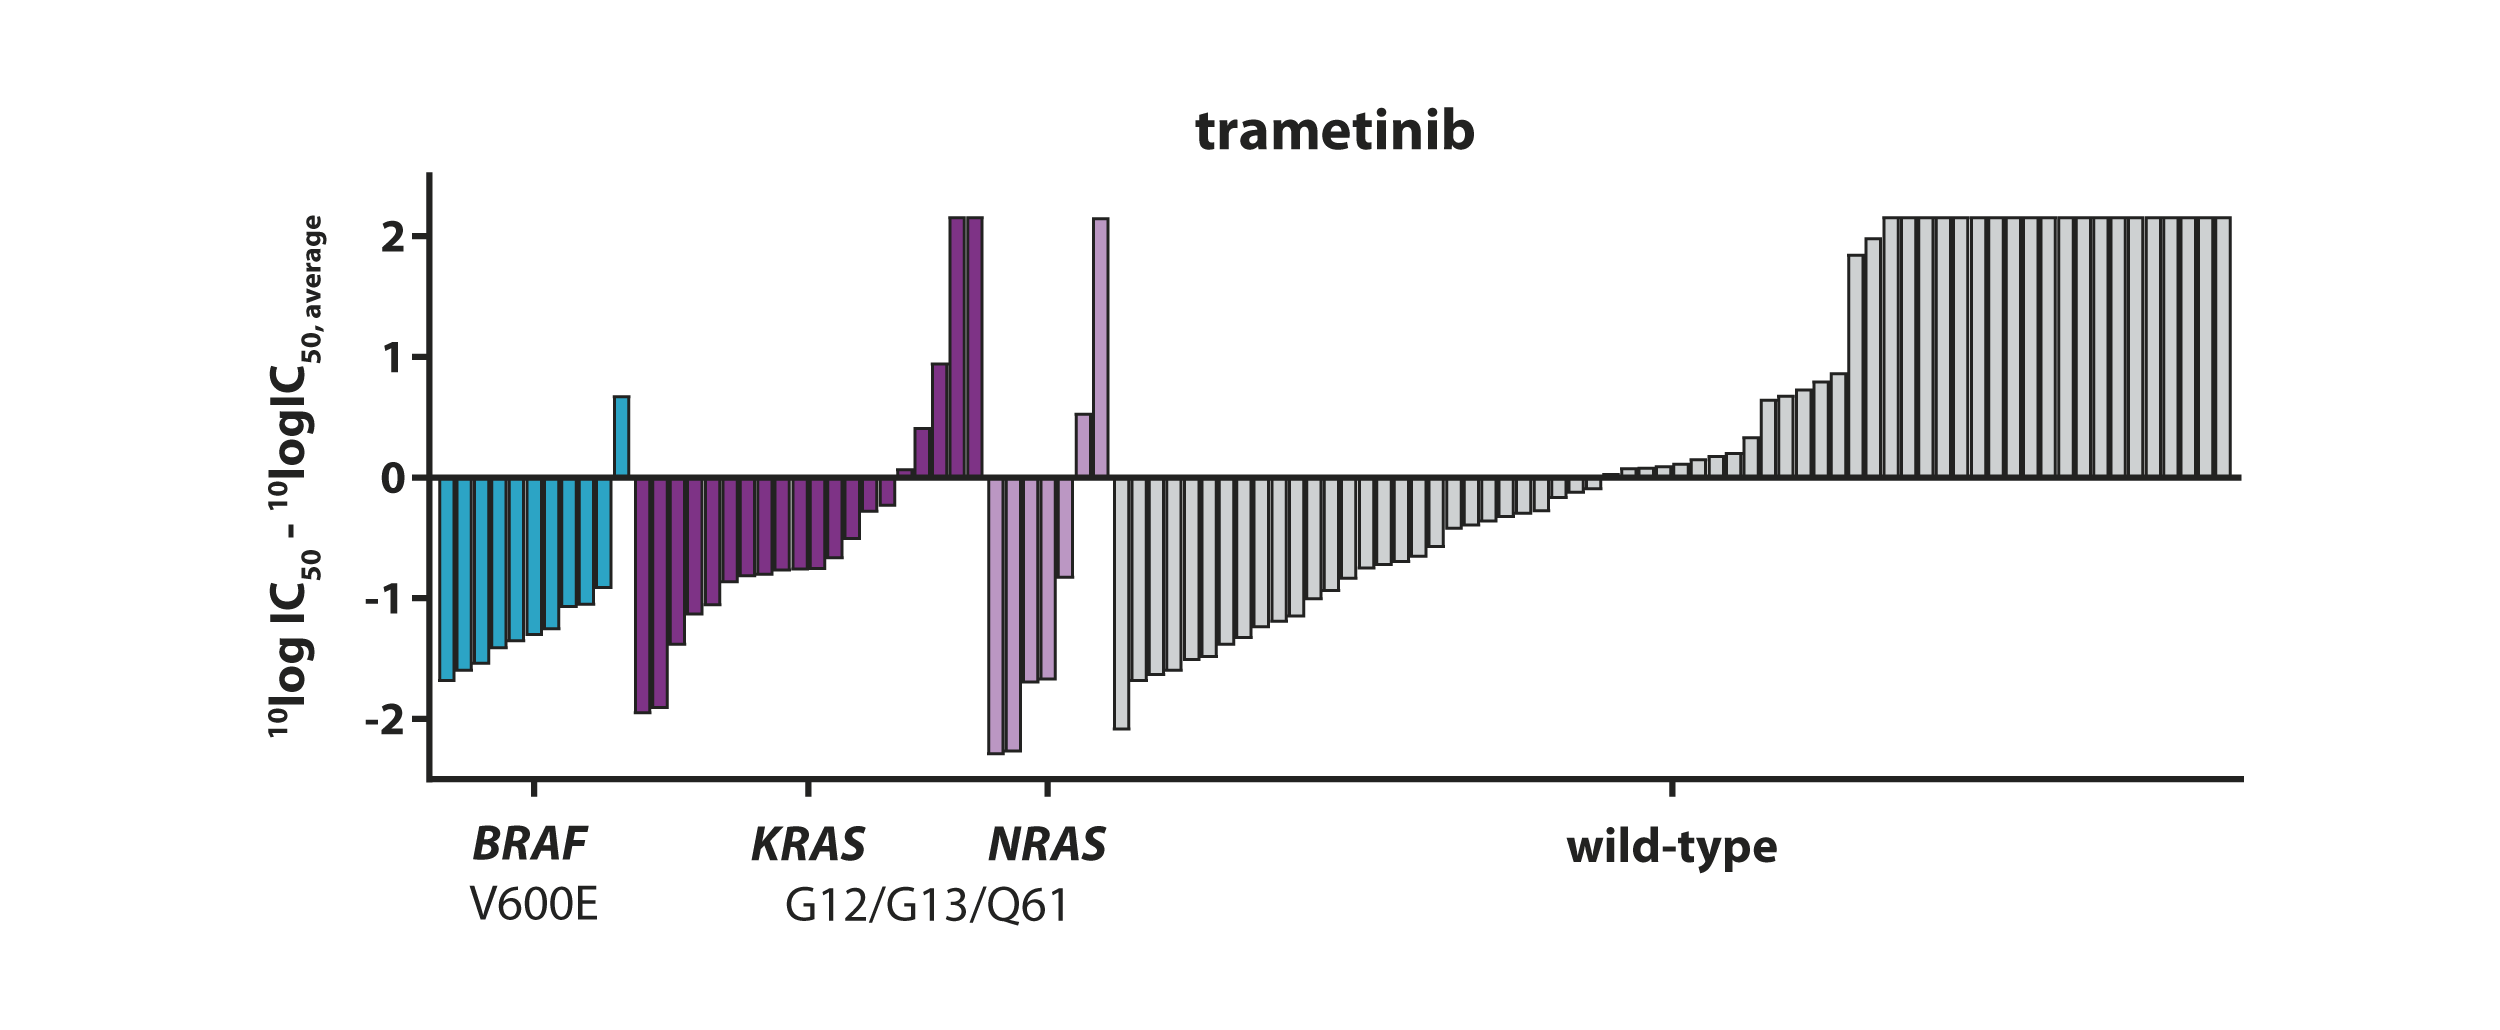
Figure 1: Waterfall plot and gene mutation analysis showing the ranking of drug response based on IC50 values of 102 cancer cell lines profiled with the MEK inhibitor trametinib.
Pearson Correlation
Figure 2: Protein expression analyses. (left) Top 10 strongest negative correlations between protein expression and 10log IC50 values of trametinib (purple) and in-house Oncolines® reference compounds (blue). A strong correlation is observed between response to trametinib and phosphorylated MEK (Pearson’s r = 0.44). (right) Correlation between response to trametinib and protein expression of phosphorylated MEK. Data points colored purple indicate KRAS-mutant cell lines, whereas blue data points indicate KRAS wild-type cell lines.