Quantitative Polymerase Chain Reaction (qPCR)

  • To study RNA expression levels of specific genes in cells

  • RNA can be extracted from several sources (cell culture, peripheral blood, ascites, etc.), which is then reverse-transcribed to complementary DNA (cDNA)

  • We have a broad library of validated PCR primers available in-house or derive primers for your gene of interest

  • We can determine the basal expression levels of genes or determine differences in expression upon treatment

  • Differences in expression levels are expressed relative to the housekeeping gene

Principle

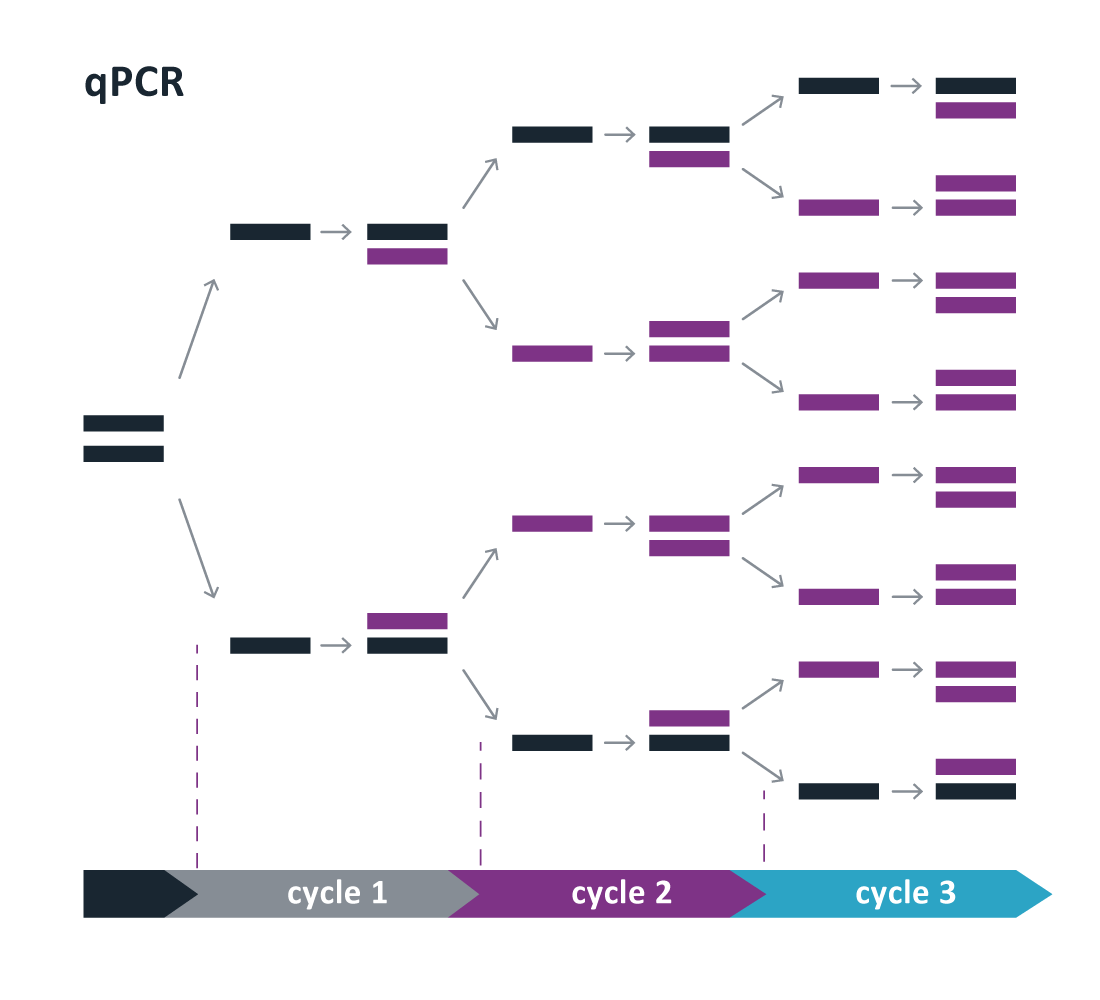
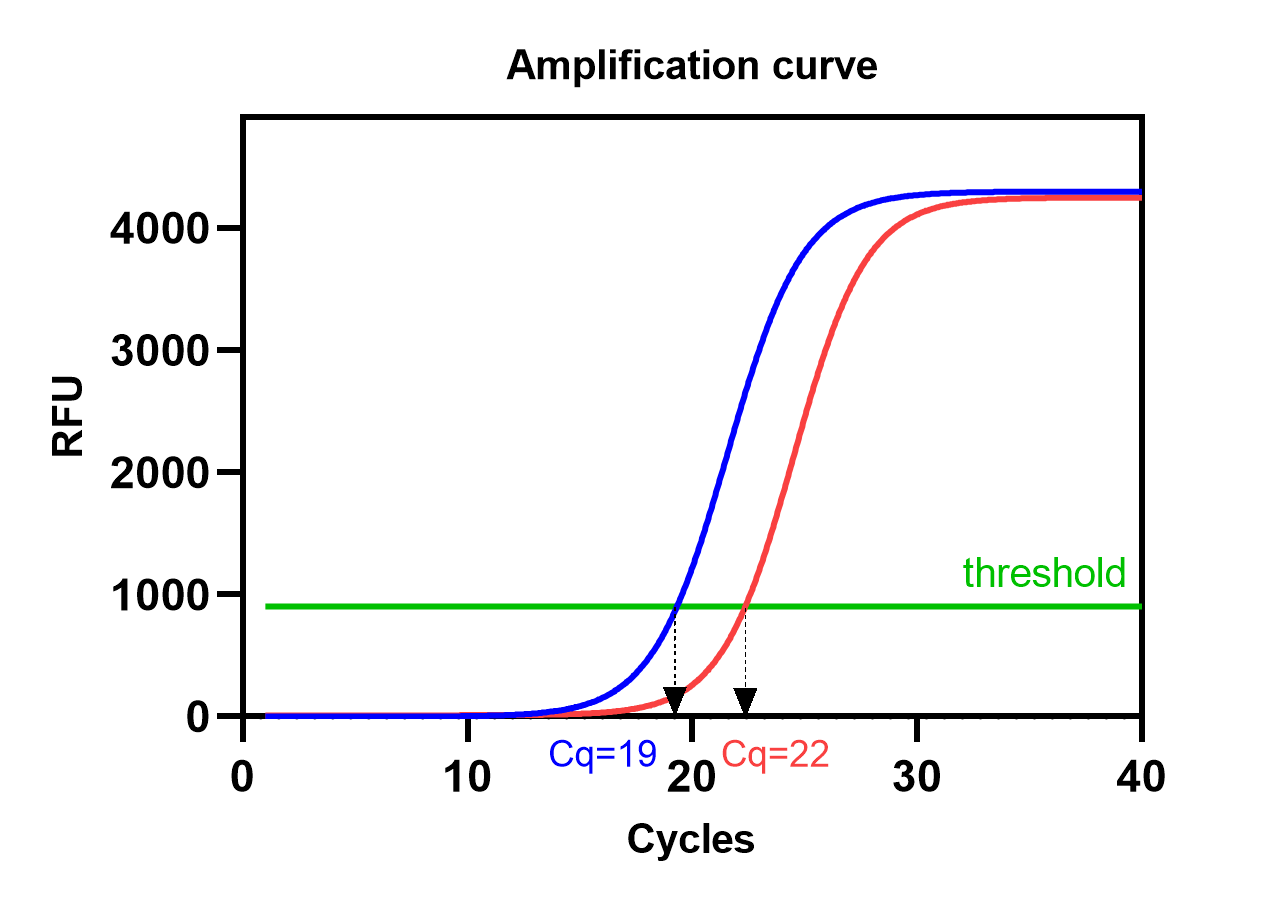
A qPCR run consists of around 40 cycles (Cq). During each cycle, three temperature stages are repeated resulting in amplification of the amount of target cDNA (figure 1). One Cq difference means that there is a twofold (Log2) difference in the amount of target cDNA. The amount of amplified cDNA is measured after each cycle using a fluorescent probe and will be plotted in the amplification curve (figure 2). The moment the amplification curve crosses the threshold is called the Cq value. The threshold is set by the machine software itself to distinguish relevant amplification from the background signal. It is usually the moment where the exponential phase of the curve starts to become linear. The lower the Cq value, the more RNA copies of the specific gene were present in the sample.

Figure 1: Schematic overview of qPCR run. In each cycle, the amount of target cDNA is doubled.

Figure 2: Example of amplification graph. Amplification curves of two samples are shown. Amount of target cDNA from the sample represented in the blue curve is 8 times (3 Cq) higher than the amount of target cDNA represented in the red curve.