SynergyScreen™
SynergyScreen™ Characteristics
SynergyScreen™ example
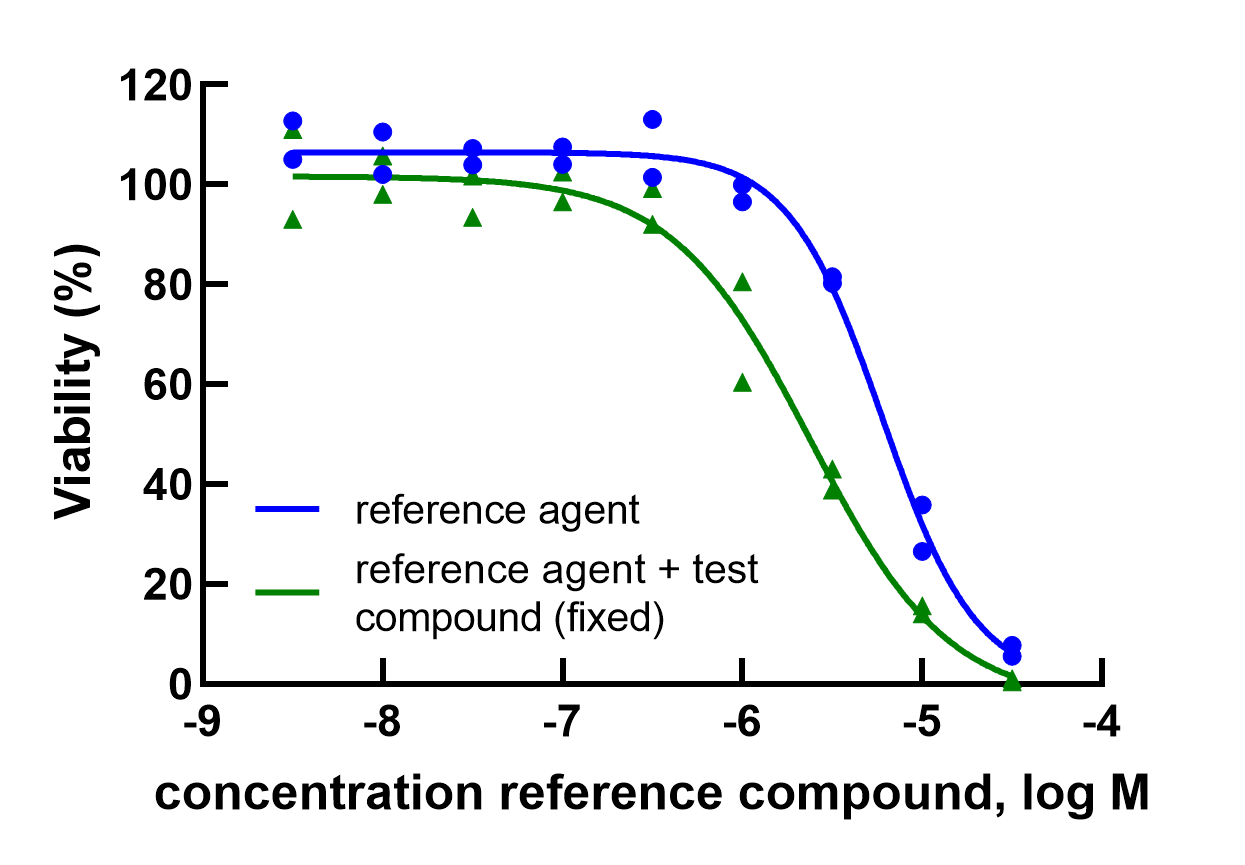
SynergyScreen™ is a large combinatorial screen in which your compound will be screened against a panel of 48 representative agents. The 48 anti-cancer agents each represent a group of compounds acting on the same target or by a similar molecular mechanism. Your compound will be added as a fixed dose to the full dose-response curve of the reference agent. The dose-response curve of the reference agent alone will be taken along as well. Synergy will be determined via curve-shift analysis. When an IC50 shift larger than 2 is observed, an independent repeat experiment will be performed to confirm the synergistic hit.
Anti-Cancer Reference Library
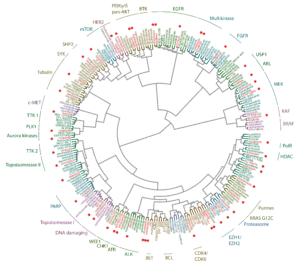
The Oncolines profiling dataset is continuously growing through profiling of novel anti-cancer agents in the Oncolines® cancer cell line panel. This dataset includes 248 anti-cancer reference agents comprising of agents used for standard of care as well as clinical stage candidates and experimental therapeutics. IC50 profiles of the anti-cancer reference agents are compared and visualized in the clustering wheel. Based on the clustering, drug classes with a similar mechanism of action can be identified. Oncolines has selected 48 anti-cancer agents representing the different drug classes to be used in the SynergyScreen™. This selection is flexible: reference agents can easily be added or swapped. Oncolines is happy to assist you in selecting suitable reference agents for your study.