SynergyFinder™
SynergyFinder™ Characteristics
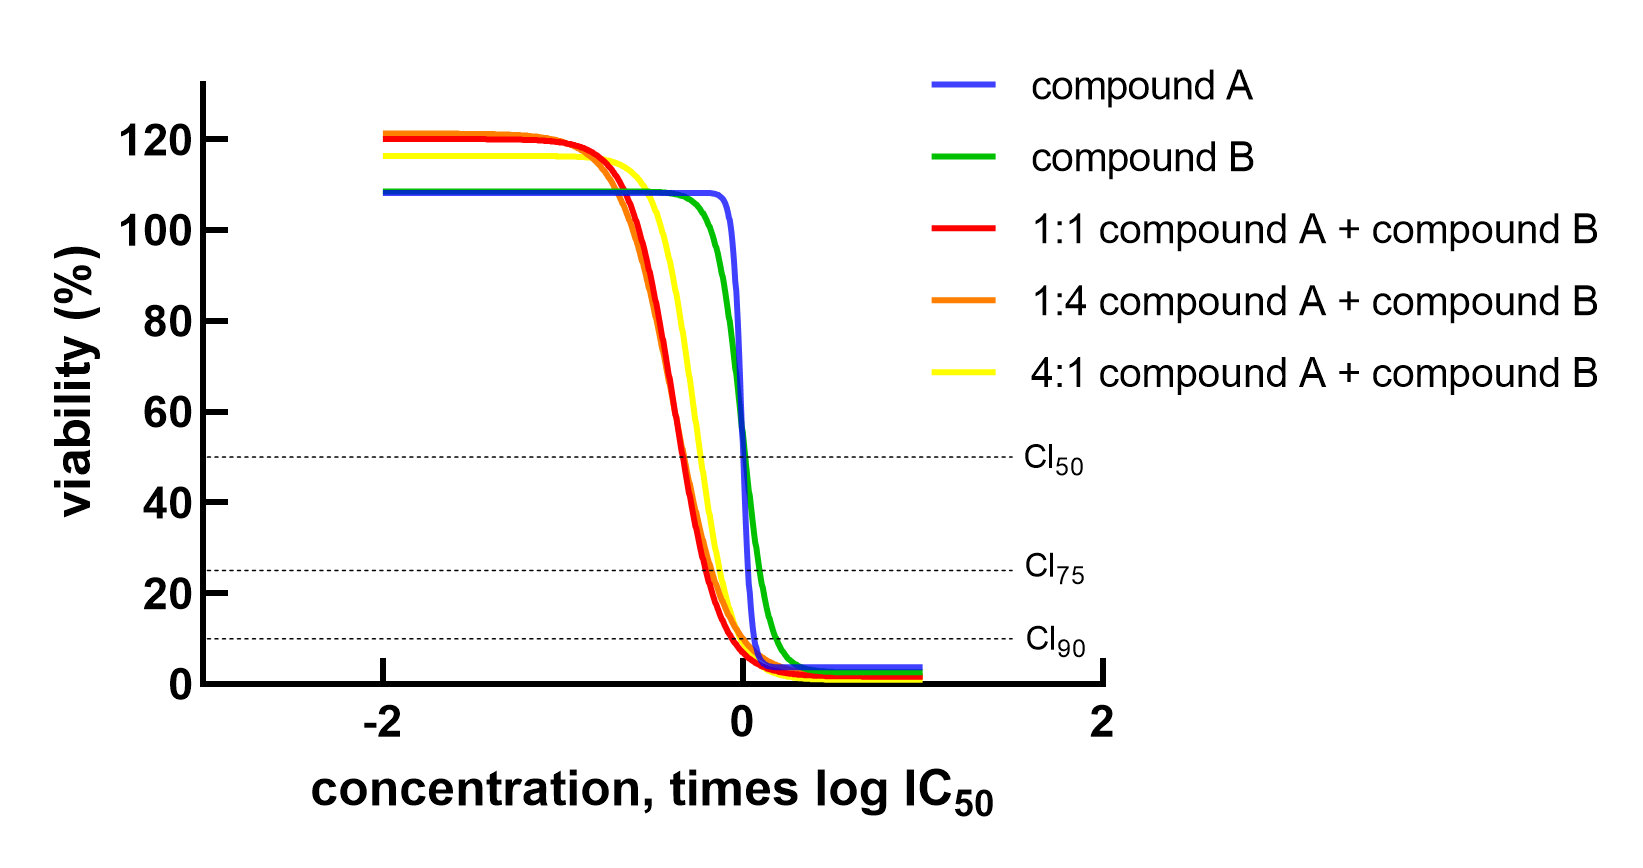
Dose response curves of single agents (green, blue) and fixed ratio mixtures (orange, yellow, red) allow for curve-shift analysis. Combination index is calculated at three different effect levels.
To identify the right combination of your lead compound with standards of care or new drugs, we have developed SynergyFinder™. In SynergyFinder™ experiments, equipotent mixtures of the anti-cancer drugs are used in three different fixed ratios. The mixtures contain fixed ratios of Compound A at IC50 and Compound B at IC50. Since Compound A and Compound B are equipotent (i.e., both are at IC50), they are interchangeable and there is no dilution effect of mixing the compounds. These mixtures are then further diluted into a seven points dose-response curve. Overlays are prepared of the dose-reponse curves of the different mixtures and the single agents. Synergistic effects are evaluated by curve-shift analysis, calculation of the Combination Index (CI), and visualization with isobolograms.
CI Index
As a secondary analysis, we use the experimental data to generate Chou Talalay Combination Indices (Chou, 2010) providing an independent, quantitative assessment of synergy. The CI Index is the most-used measure of synergy. It can be seen as the ‘dose reduction’ caused by synergy.
The CI is dependent on the fraction effect considered (e.g. 75% growth inhibition). This is visualized in the chart on the right: the x-axis represents the fraction effect (F) and the y-axis shows the corresponding CI value. Oncolines determines CIs at various effect sizes and drug ratios. Generally, a CI < 1 indicates synergy for a compound pair, a CI < 0.3 indicates strong synergy, as described by Haagensen et al. (2012). CI > 1 indicates antagonism.
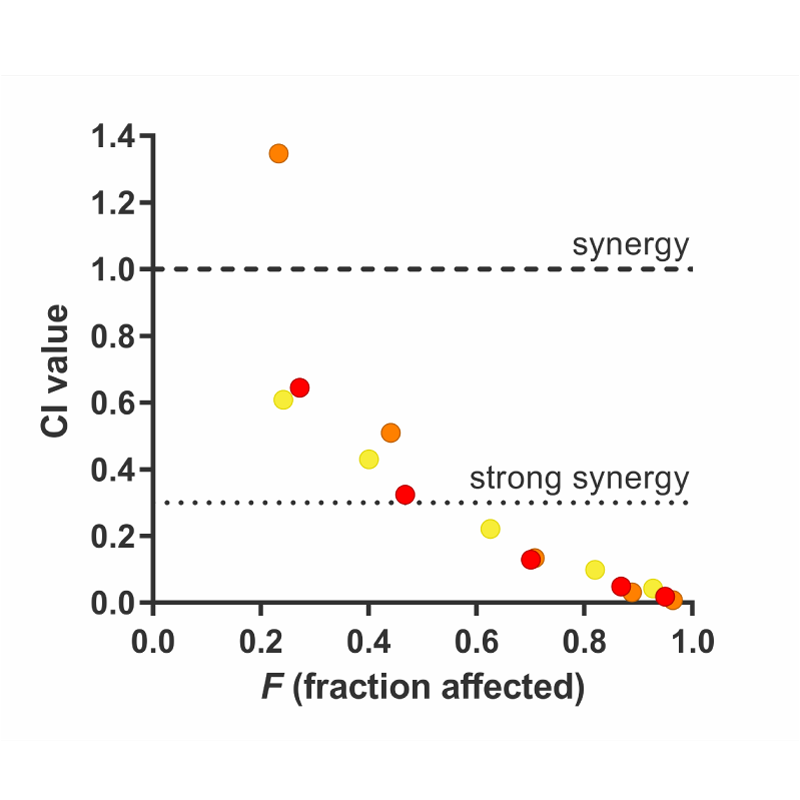
CI values for the combination of a MEK and PI3K inhibitor at various effect levels. Circles represent experimentally determined CI values (Chou Talalay method). The colors (orange, yellow, red) represent the fixed ratio mixtures.
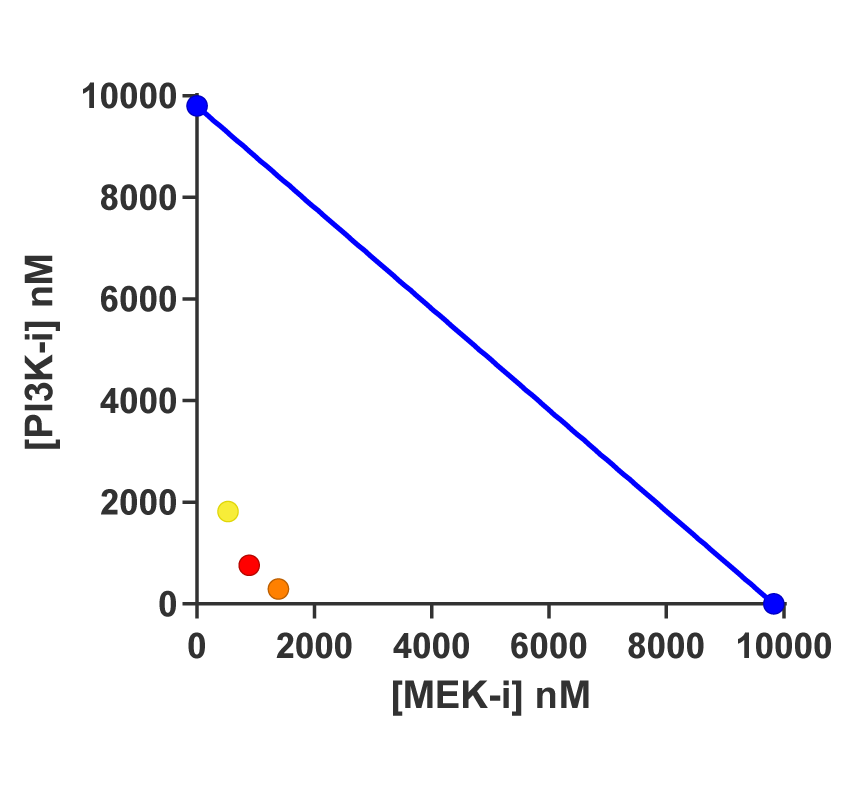
Isobolograms
An isobologram is a graphic way of assessing if combinations show synergy. It shows the effect of a combination at a particular effect level, for instance 50% or 75%. The isobologram draws an isobolic line of theoretical additivity. It is a straight line between the concentration of Compound A to achieve the effect (x-axis) and the concentration of Compound B (y-axis). Mixtures below the line are synergistic. Below the line indicates that the compound concentrations can be decreased to achieve the same effect.